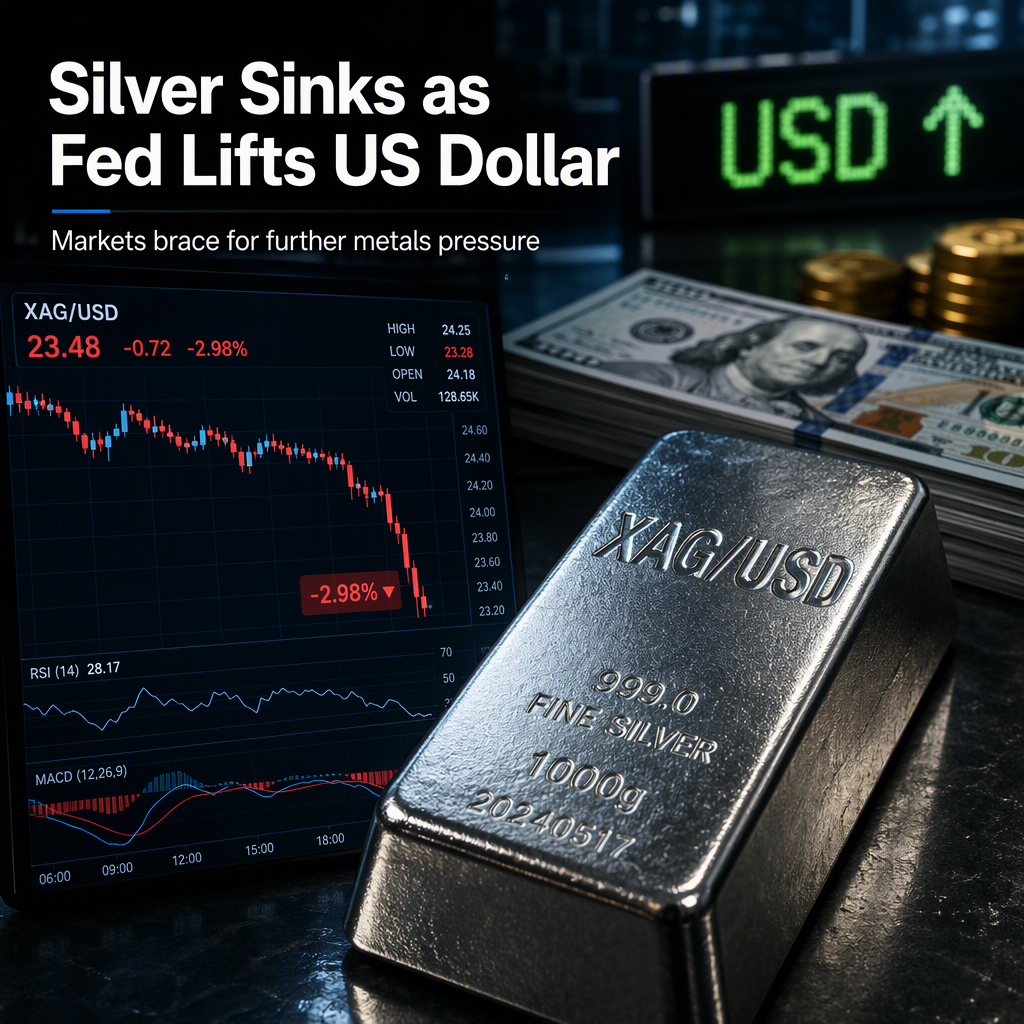
Silver (XAG/USD) declined by nearly 3% on Wednesday, driven by a hawkish outlook from the Federal Reserve that propelled the US Dollar to a two-month high and exerted downward pressure on non-yielding metals, including gold, which also fell by more than 1% [1]. At the time of reporting, silver was trading around $65 [1].
Despite these headwinds, silver remains within the trading range it has held since mid-August. The 100-day Simple Moving Average (SMA) near $66 continues to cap the upside, while the 50-day SMA at $63 provides underlying support [1]. Technical indicators on the daily chart, such as the Relative Strength Index (RSI) near 50 and the Moving Average Convergence Divergence (MACD) just below zero, suggest a lack of clear directional conviction, with neither buyers nor sellers in control [1]. The subdued Average Directional Index (ADX) near 12 indicates that a break of nearby support or resistance levels is needed to define a clearer trend [1].
On the 4-hour chart, silver's short-term outlook appears weaker. XAG/USD has retreated from $67.50 and is now testing the 50-period SMA near $65, after slipping below the 100-period SMA at $65.35 and the 200-period SMA at $66 [1]. The RSI is around 45, and an expanding negative MACD histogram points to growing selling pressure [1]. For buyers, reclaiming the 100-period SMA at $65.35 and the 200-period SMA at $66 are key steps, with further resistance at $67.50 and $70.50 [1]. On the downside, a break below the 50-period SMA would bring $63 into focus, and a further drop could expose $60 and then $55 [1].
No analyst opinions or forward-looking statements beyond technical levels were provided in the article [1].
CONCLUSION
Silver's nearly 3% decline reflects the impact of a stronger US Dollar following the Federal Reserve's hawkish stance. While the metal remains range-bound, technical indicators suggest growing selling pressure and the potential for further downside if key support levels are breached.