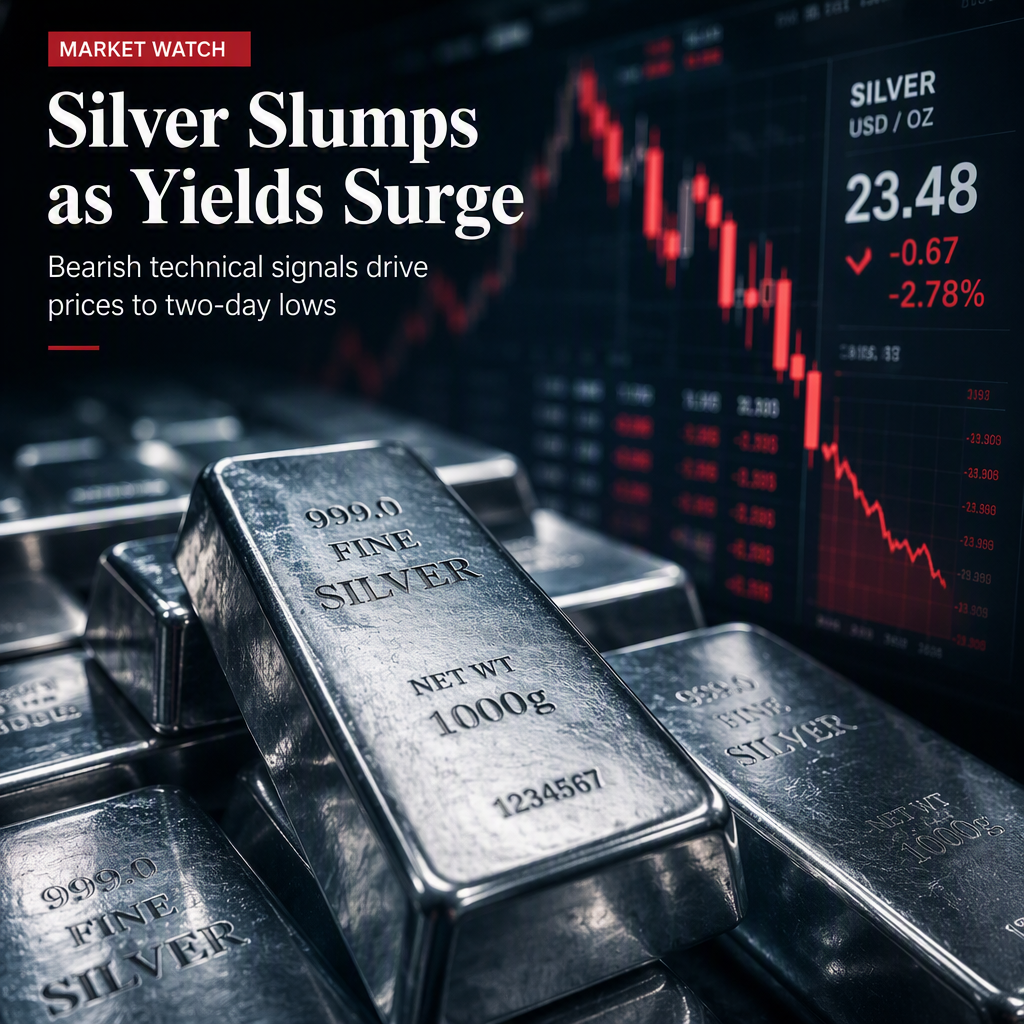
Silver prices faced significant downward pressure, failing to break through a key technical resistance near $67.00 and retreating to two-day lows at $65.31, marking a 1.42% loss for the session [1]. The decline was attributed to elevated US bond yields, which were driven by rising inflationary pressures, undermining the appeal of the non-yielding metal [1].
From a technical perspective, silver appears to be forming a head-and-shoulders chart pattern, which typically signals bearish implications, though the pattern has not yet been confirmed [1]. After peaking two weeks ago at $71.12, silver fell to $65.58 before attempting another rally, which was capped by the 100-day Simple Moving Average (SMA) at $67.27 [1]. Since then, momentum indicators such as the Relative Strength Index (RSI) have turned bearish, suggesting that traders are positioning for further downside [1].
If silver (XAG/USD) falls below $65.00, it could pave the way for a test of the September 2 low at $63.32. A breach of this level would confirm the head-and-shoulders formation, potentially opening the door for a move toward the $55.00 psychological mark [1]. Conversely, if silver manages to reclaim the 100-day SMA, a move back toward $70.00 is considered likely [1].
No analyst opinions or forward-looking statements beyond these technical scenarios were provided in the article [1].
CONCLUSION
Silver's recent price action reflects growing bearish sentiment, with technical indicators and rising US yields weighing on the metal. A break below key support levels could trigger further declines, while a recovery above the 100-day SMA may offer some upside potential. Market participants are closely watching these technical thresholds for the next directional move.