
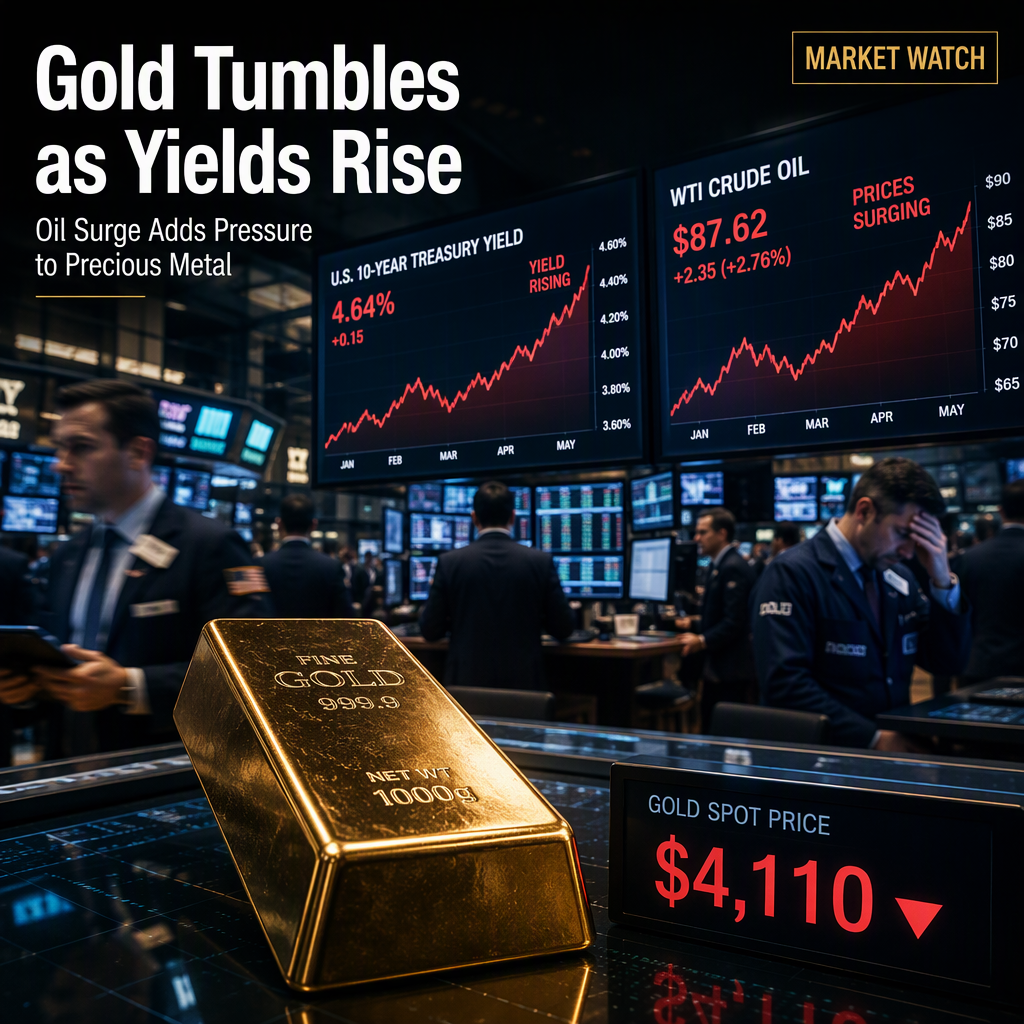
Gold prices (XAU/USD) fell sharply to near $4,125 during the early Asian session on Tuesday, extending a weekly decline as the precious metal faced selling pressure from rising US Treasury yields and higher oil prices [1]. The yellow metal tumbled by over 4% to $4,110, marking its lowest level since August 5 in the previous session, as oil prices climbed and the benchmark 10-year US Treasury yields reached their highest since June 2007 before paring gains [1]. Higher energy prices are fueling inflation concerns, but the high interest rate environment is increasing the opportunity cost of holding gold, a non-yielding asset [1].
Tim Waterer, chief market analyst at KCM Trade, commented, "The high bond yields and high oil price tandem continue to act as a thorn in gold’s side. Oil prices have risen on mixed signals about oil flows, which is keeping inflation front and centre for investors" [1]. Analysts at Deutsche Bank noted that gold came under renewed pressure last week, with prices falling “-2.14% (+0.23% Friday), as higher real and nominal yields put downward pressure on precious metals as a non-interest-bearing asset.” While there was a modest rebound into the weekend, the broader move underscores gold’s vulnerability in an environment of rising real and nominal yields [1].
Technical analysis shows that XAU/USD maintains a bearish near-term tone, trading beneath the 100-day simple moving average (SMA) and the Bollinger Bands’ middle line. The metal is also below the latest Bollinger lower band, indicating persistent downside pressure, with the Relative Strength Index (14) around 35, just above oversold territory, suggesting stretched but still weak momentum [1]. Initial resistance is seen at the Bollinger lower band near $4,190, followed by the 100-day SMA at $4,300 and the Bollinger middle band at $4,335. A stronger rebound would face a barrier at the Bollinger upper band around $4,480, and only a sustained break above this area would indicate a shift from the current downside bias [1].
Traders are awaiting the US Personal Consumption Expenditures (PCE) Price Index and US jobs data later this week for further clues about the US interest rate path. If these reports show weaker than expected outcomes, it could drag the US Dollar (USD) lower and lift the USD-denominated commodity price [1].
CONCLUSION
Gold is under significant pressure due to rising US Treasury yields and higher oil prices, with technical indicators pointing to continued downside momentum. Market participants are closely watching upcoming US economic data for potential shifts in the interest rate outlook, which could impact gold’s trajectory. The current environment suggests heightened vulnerability for gold as a non-interest-bearing asset.