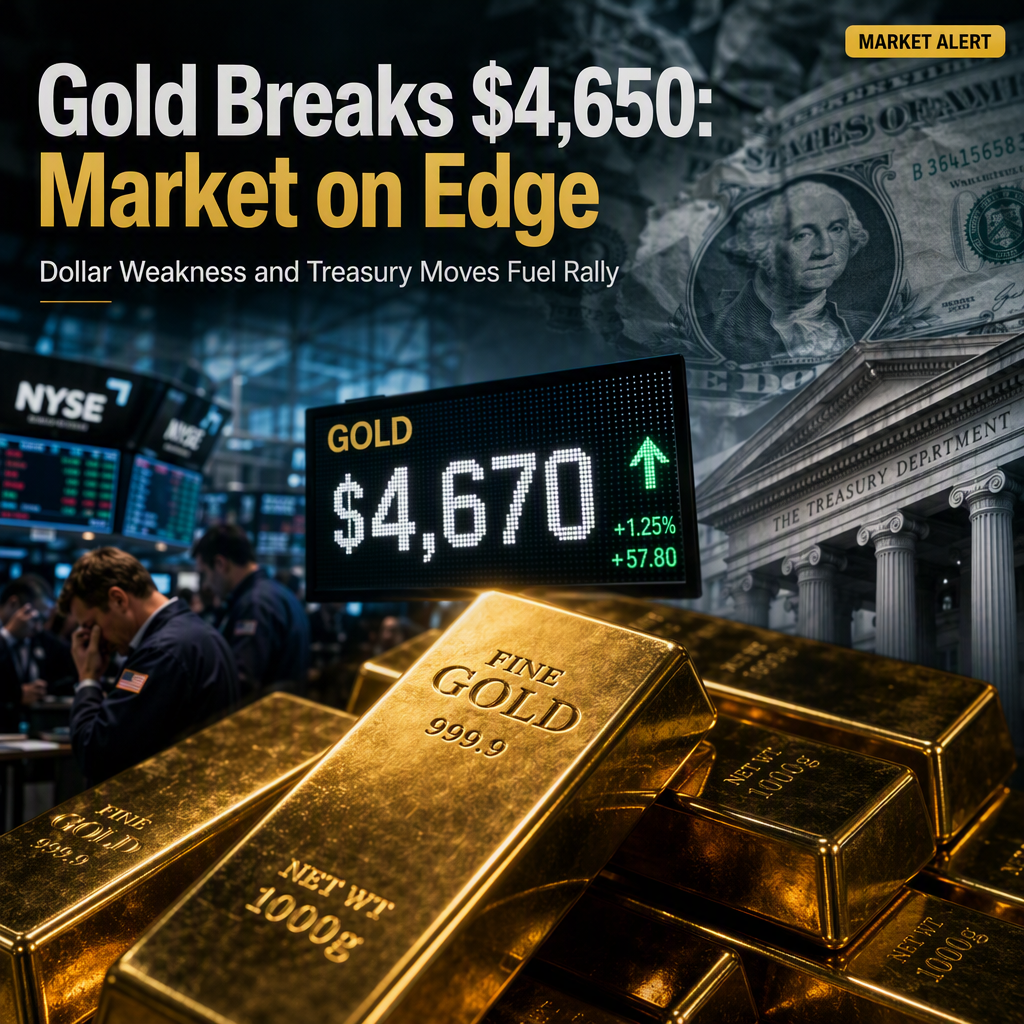
Gold prices (XAU/USD) climbed to approximately $4,670 during the early Asian session on Wednesday, marking the highest level since May 14. This rally was driven by a weaker US Dollar and the US Treasury's announcement of expanded bond buyback plans. US Treasury Secretary Scott Bessent indicated last week that the government could increase bond buybacks beyond $4 billion, following the department's decision to double buybacks of longer-dated securities. This policy move has led to lower long-term yields and triggered significant short-covering in the market [1].
A softer US Dollar has made USD-denominated gold more attractive to foreign investors, while declining Treasury yields have reduced the opportunity cost of holding non-yielding assets like gold. However, rising tensions between the US and Iran, highlighted by the Trump administration's expansion of secondary sanctions on entities and countries doing business with Iran, could stoke energy-driven inflation concerns. This scenario may increase the likelihood of Federal Reserve rate hikes in the coming months, potentially capping further gains for gold, which is often used as an inflation hedge but becomes less attractive when interest rates rise [1].
Market participants are closely watching for signals from the upcoming speech by US Federal Reserve Chair Kevin Warsh at the Jackson Hole Symposium on Friday, seeking further clarity on the interest rate outlook. Any hawkish commentary from Fed officials could exert downward pressure on gold prices in the near term [1].
Analysts at TD Securities caution that the recent gold rally may be premature given the current macroeconomic environment. They note that with markets still pricing in rate hikes for 2027 and ongoing risks in the energy market, the rally could be vulnerable and may not signal a renewed run to record highs for gold [1].
From a technical perspective, gold maintains a bullish near-term bias, trading well above the 100-day simple moving average and the Bollinger middle band. However, the Relative Strength Index (RSI) at around 73 indicates overbought conditions, suggesting that while upside momentum is strong, it may be stretched. Key support levels are identified at $4,380 (100-day SMA), $4,340 (Bollinger middle band), and $3,955 (lower Bollinger band), while immediate resistance is seen at $4,725 (Bollinger upper band) [1].
CONCLUSION
Gold's recent surge above $4,650 is underpinned by US Dollar weakness and Treasury bond buyback plans, but faces potential headwinds from inflation risks and possible Fed rate hikes. Analysts urge caution, noting that the rally may be overextended in the current macro environment. Market participants are advised to monitor upcoming Fed communications for further direction.